Personal data viz projects
A selection of side projects that involve finding creative ways to visualize or analyze manually collected data.
Intro
Side projects for fun and profit
Who doesn't love a good side project? I keep a running list of nearly 100 project ideas, most of which will never see the light of day. One such project is to just publish the list of the 100 ideas — how meta is that? The 4 projects below are some of the select few that graduated from idea to execution.
Wall of Quotes
You can quote me on that
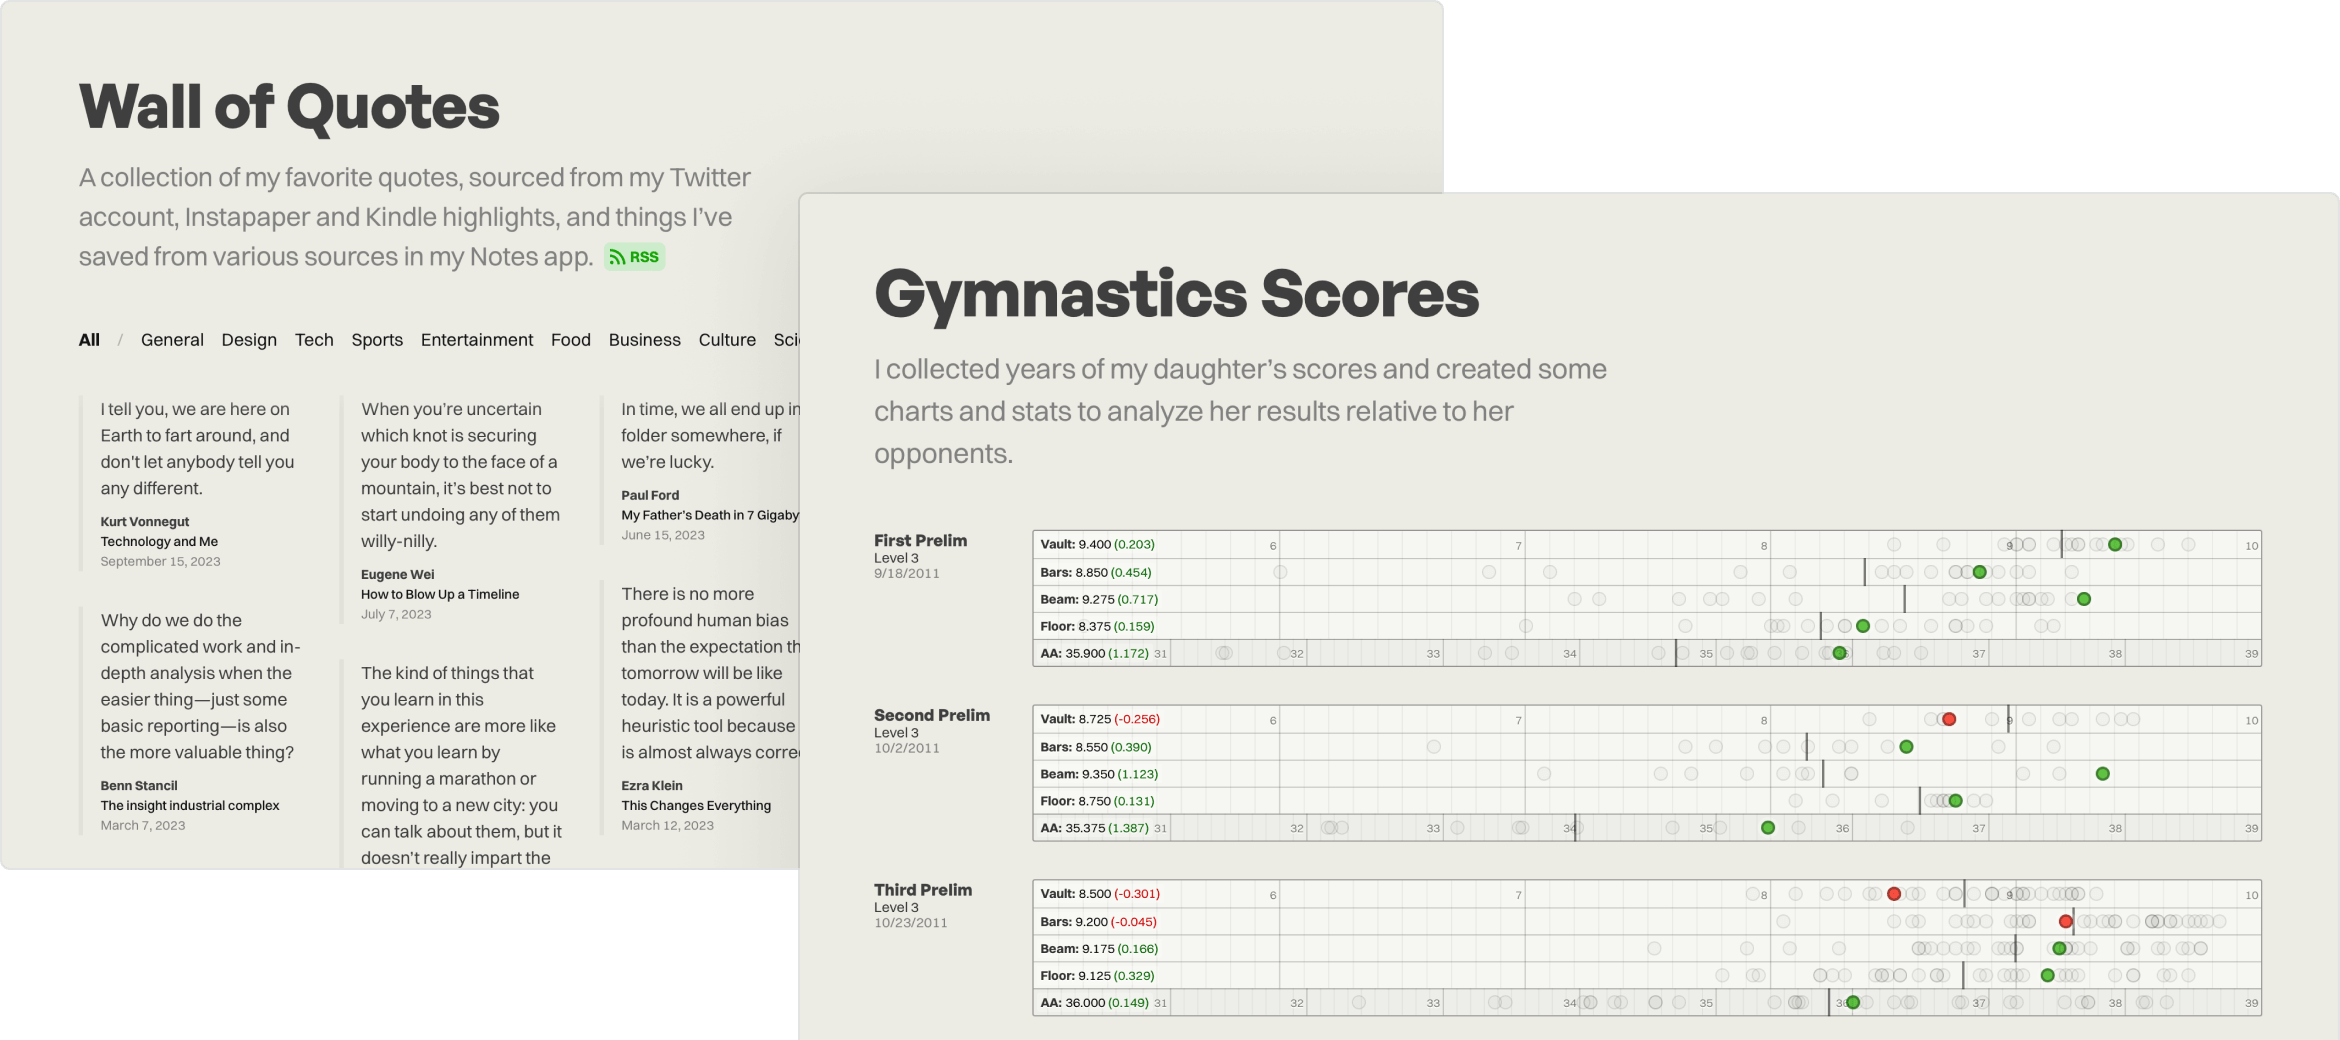
I've been collecting quotes for almost 15 years — sourced from books, articles, movies, TV shows, and overheard and direct conversations. Wall of Quotes is an ongoing project to showcase my favorite quotes, filterable by subject. The ongoing challenge with this project is corralling all the data into a common format — the collected quotes are in my Kindle highlights, Instapaper notes, Twitter, and my Notes app. It's currently a manual effort to pull all the data together in a JSON file after an attempt to automate it with IFTTT. View Wall of Quotes at my personal site.
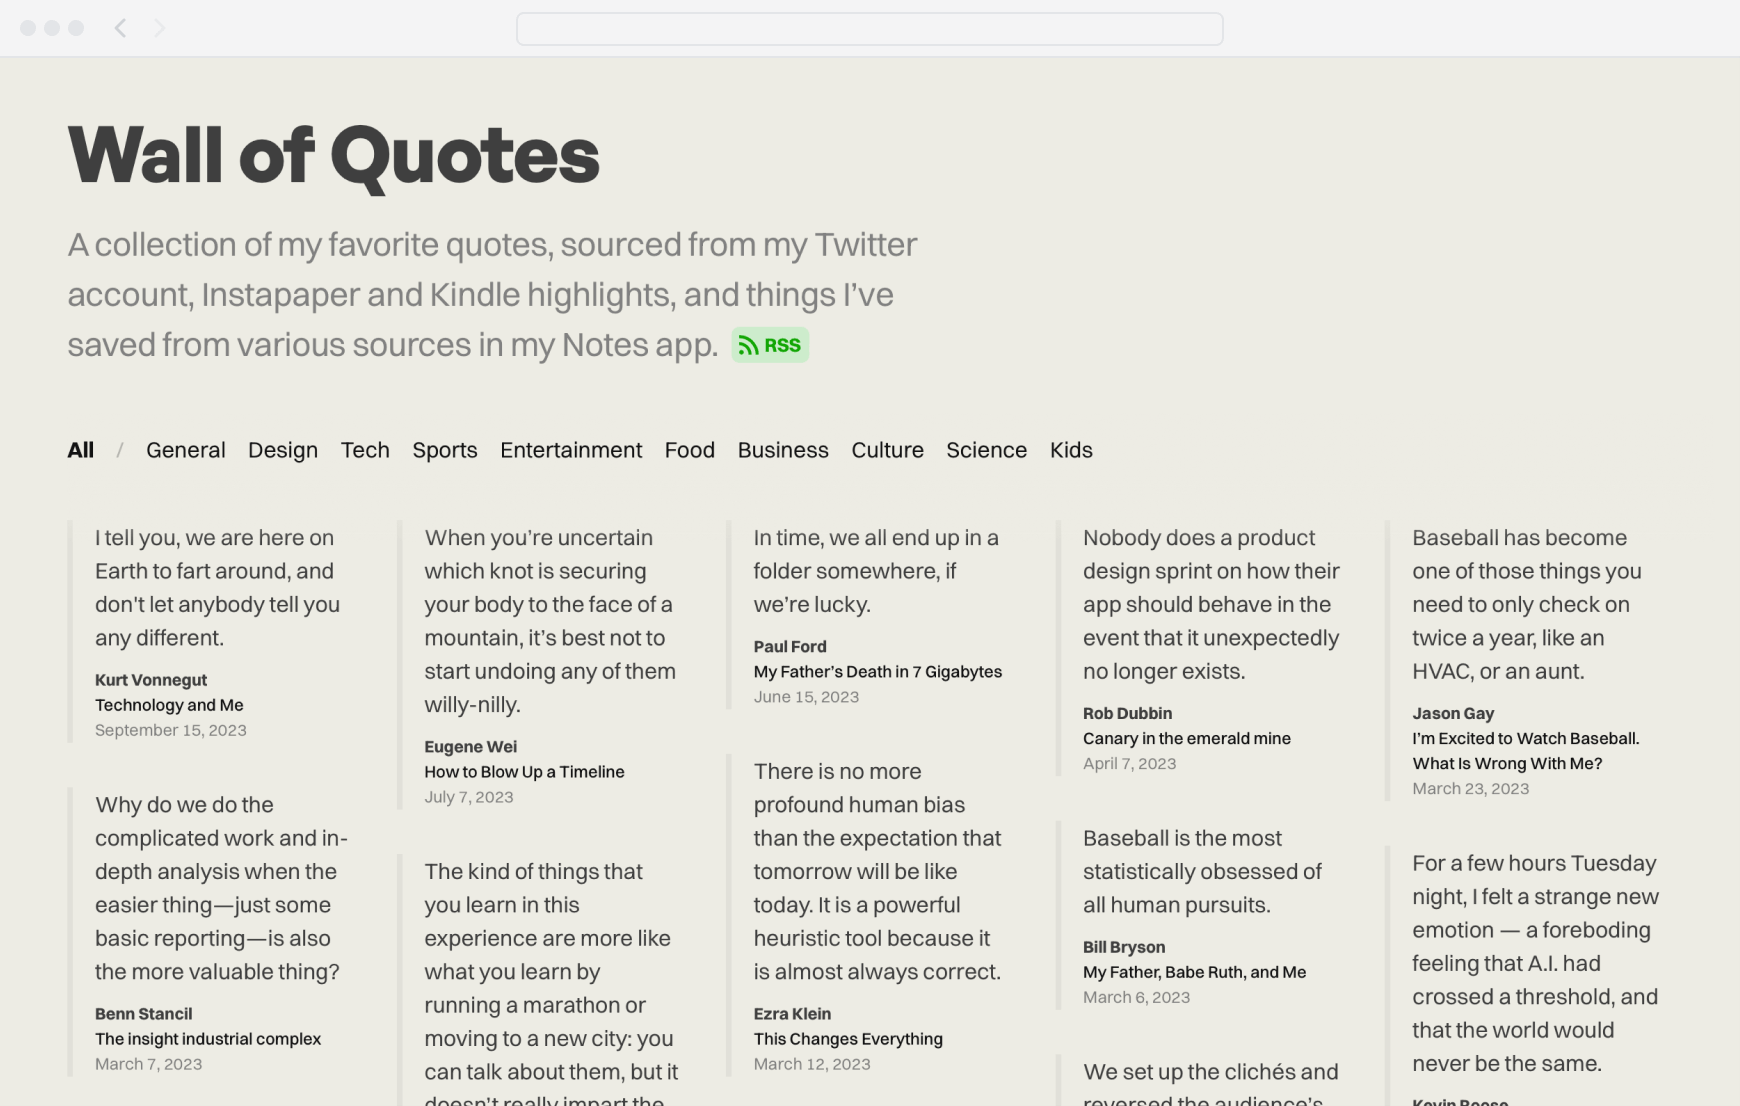
The masonry-style layout of my favorite quotes, filterable by topic.
Dribbble top players
Can good design be quantified?
When Dribbble was in its prime, they had a directory of everyone on the platform, but they understandably limited the ability to browse, sort, and filter the "players", simply sorting by the number of followers. I wanted to dig into the data and see if I could create player "stats" that helped surface designers that may not have accumulated a lot of followers due to less time on the platform or less frequent posting.
I used the Dribbble API to pull stats for the top 1,000 players and used the data from shots, views, likes, followers etc. to create new stats like "Likes Per View" and "Followers Per Shot". I rendered it all in a giant table, made each column sortable, and styled it up to match the aesthetic of Dribbble at the time. View Dribbble Top Players at my personal site.
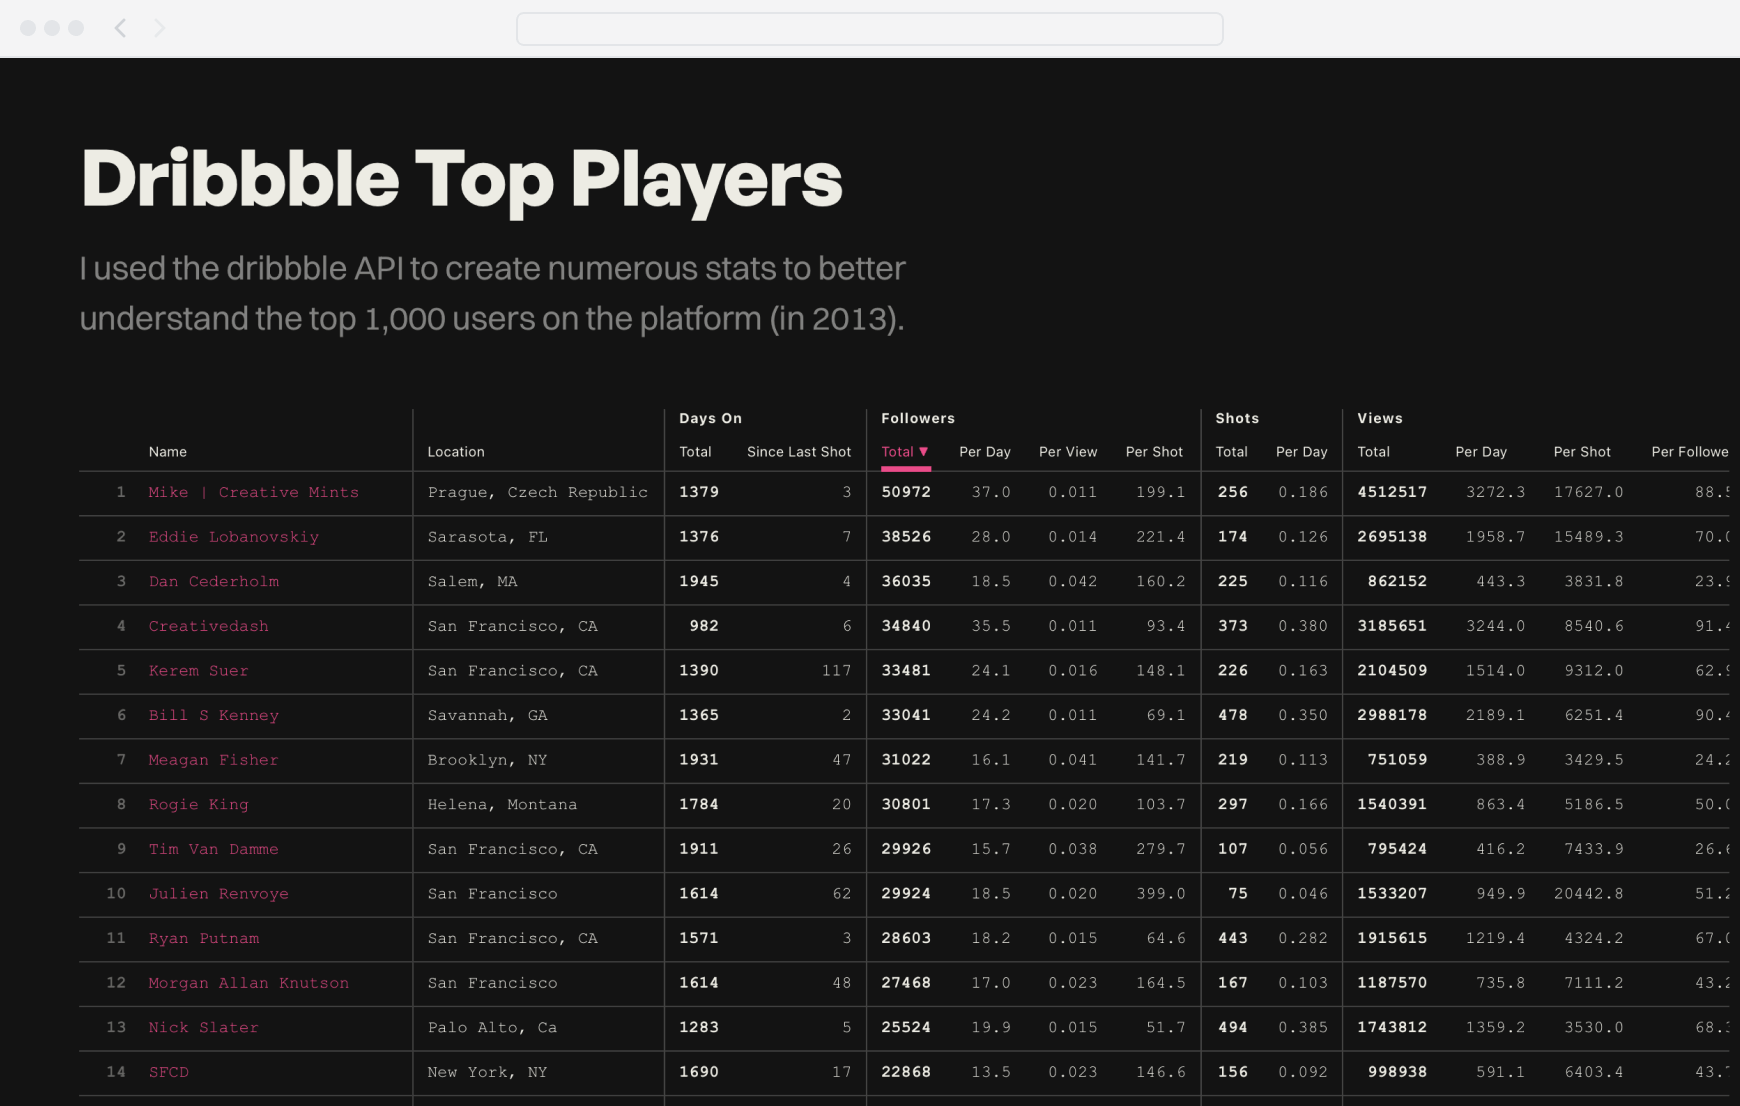
The top 1,000 players × dozens of stats = 1 gigantic, sortable table and hours of fun.
Gymnastics scores
Sticking the landing
My daughter used to be a competitive gymnast, and for 8 years I tracked the scores from all her meets. I wanted a way to visualize her performance over time, but since scoring is so subjective, it was critical to display her scores relative to all other scores from each event. I built an HTML prototype that for each event plots her competitors' scores, the average score, and her score. The data is in a JSON object, and the chart logic and layout is built with JavaScript.
In addition, I also wanted to better quantify how the scores were distributed, so I created a series of charts to visualize: difference vs the average (to adjust for the variable judging per meet), rank percentile (as a better relative measure of where she ranked), and z-score (to incorporate standard deviations as a representation for extraordinary scores). View Gymnastics Scores at my personal site.
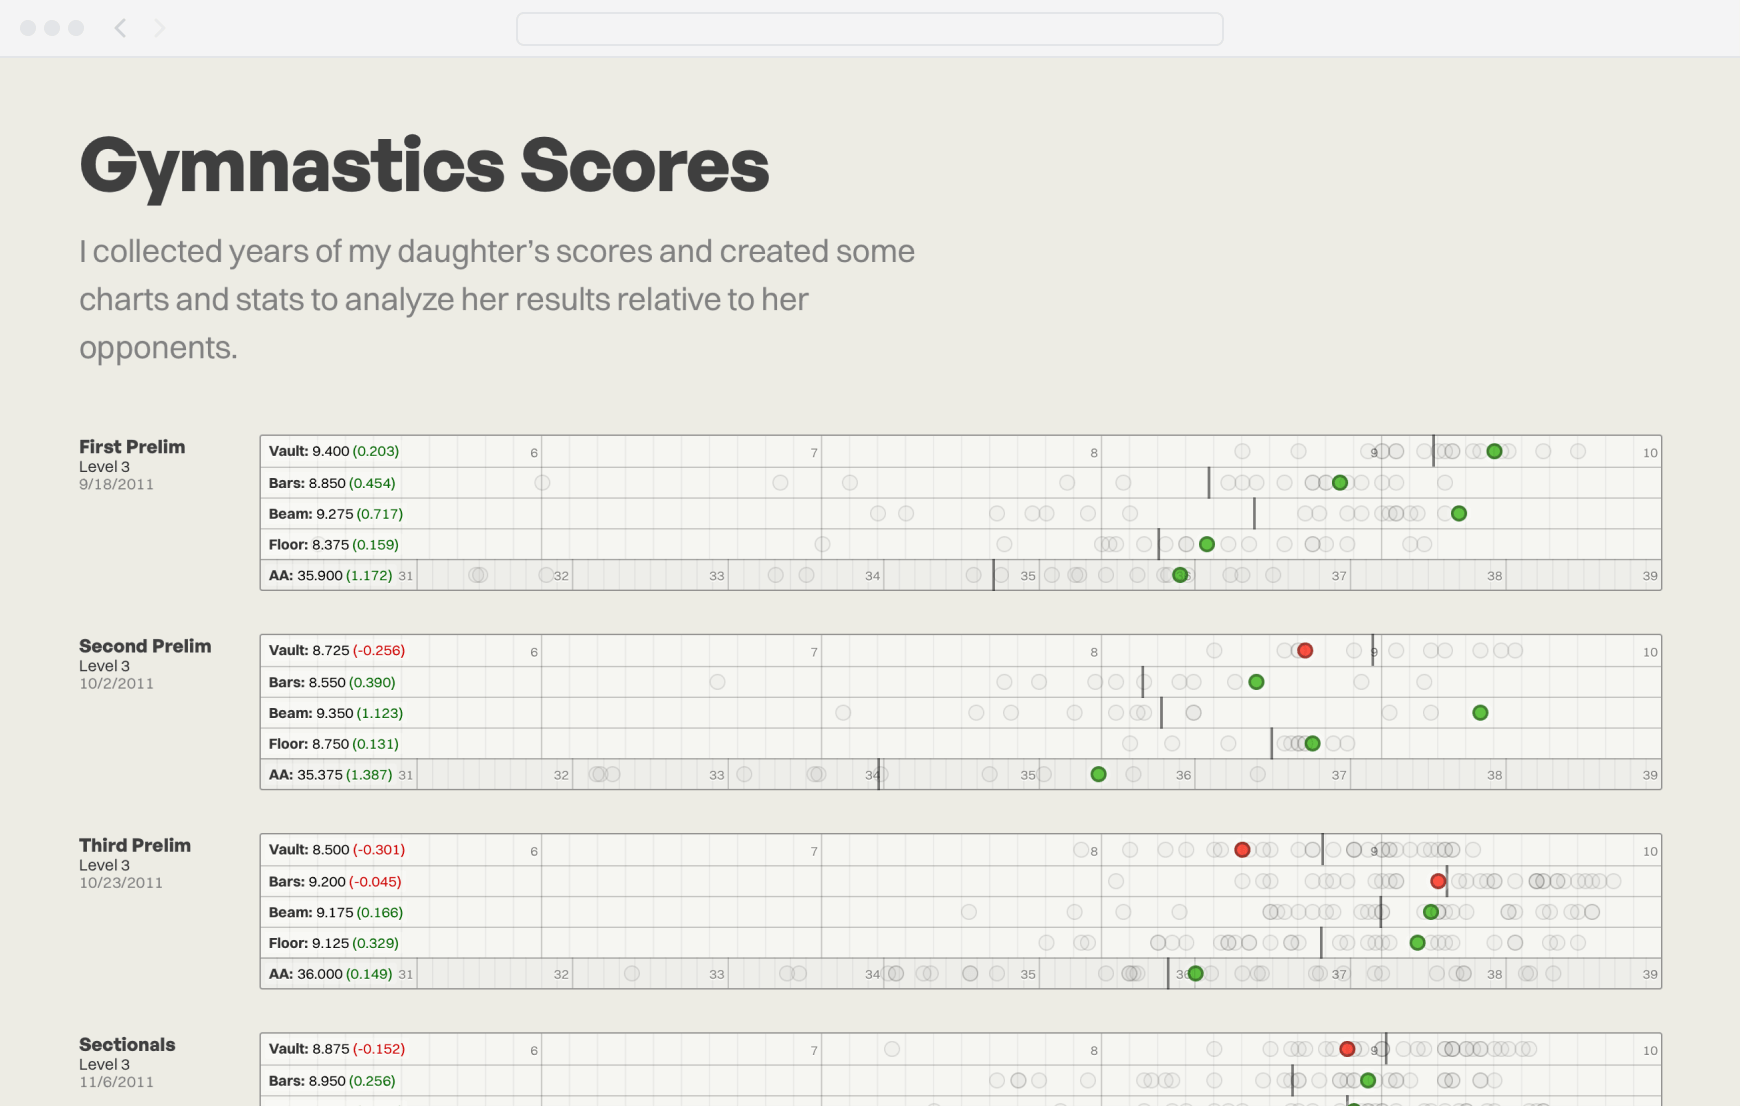
The visualization I created to see my daughter's scores relative to all other competitor scores and the average scores.
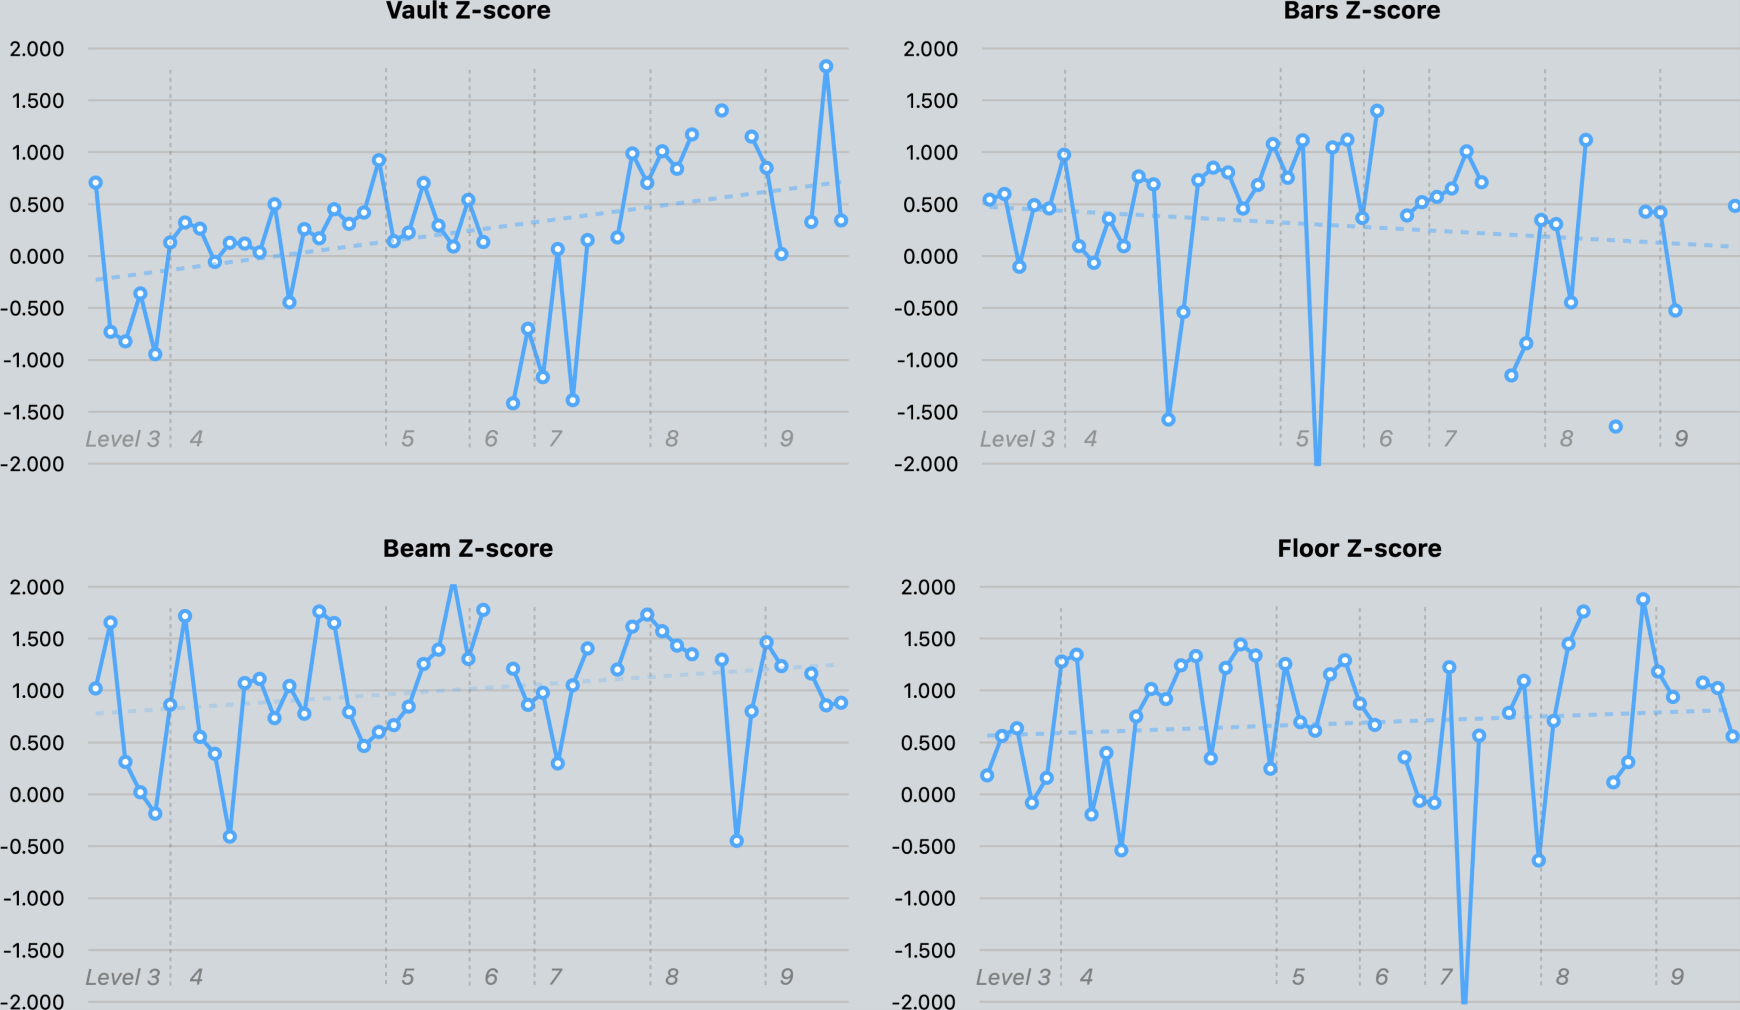
I realized that what I was trying to understand with my prototype was essentially z-score, so I went ahead and calculated all my daughter's z-scores.
Body weight
The scale doesn't lie
I've been consistently tracking my weight for 10+ years, inputting it manually in a spreadsheet before getting a smart scale that makes data collection more seamless, and made logging daily weigh-ins more practical.
I wanted to visualize trends and correlate them with significant events like diets, vacations, seasonal gorging, and illnesses. Using the fantastic Metrics Graphics library (underpinned by D3) to build the visualization, I heavily customized the UI to get the look I wanted. A couple notable features are the rug plot on the y-axis (to linearly see where weights cluster) and a brush tool to zoom in (handy to zero in on shorter term trends). View Body Weight at my personal site.
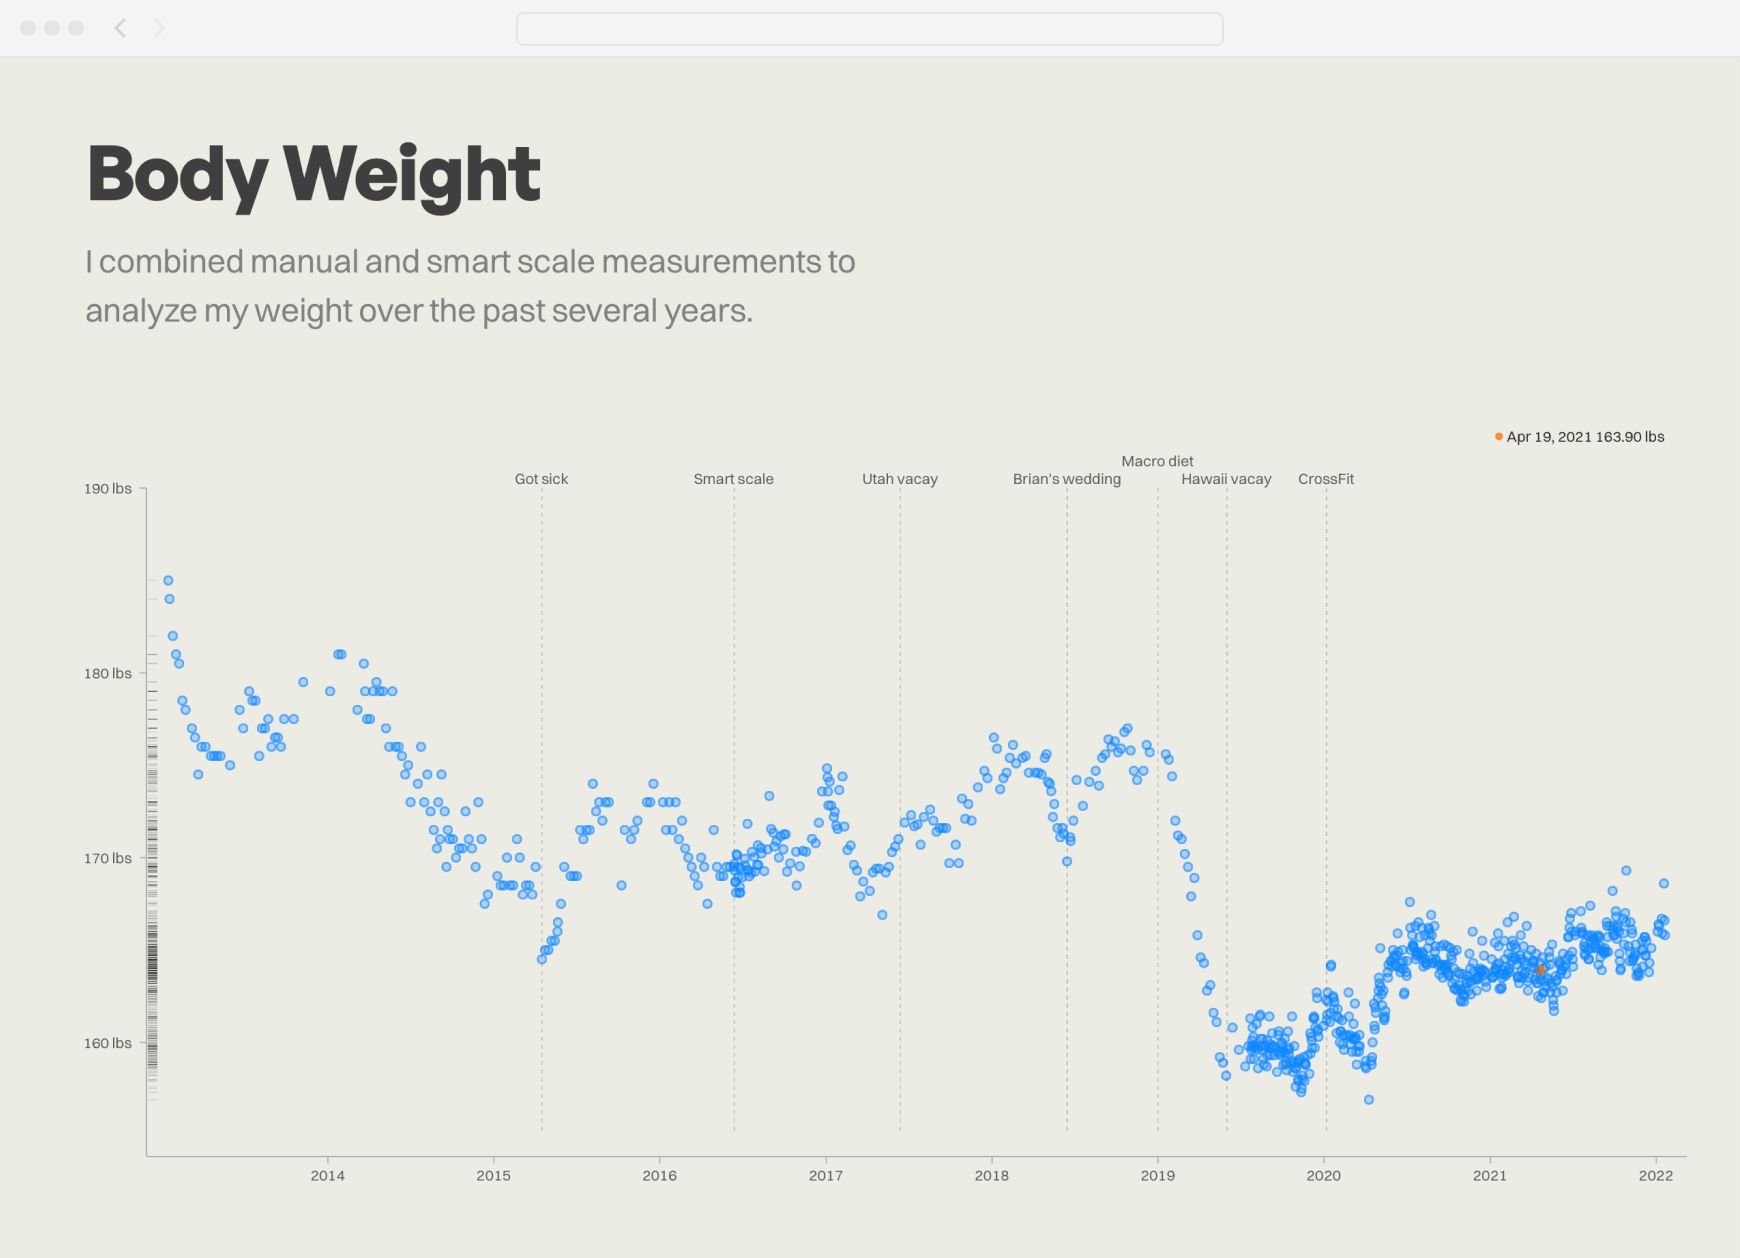
If my weight was a stock, you'd make a ton of money buying in May and selling in January.
More Featured Work

Hi, I’m Josh Fallon — a principal product designer in Los Angeles with several years of in-house experience managing, designing, and launching products on web and native platforms for both large organizations and startups. More about me